Signature Forgery Detection Using Siamese Networks
Project Abstract and Scope
Institutions and businesses recognize signatures as the primary way of authenticating transactions. People sign checks, authorize documents and contracts, validate credit card transactions and verify activities through signatures. As the number of signed documents and their availability has increased tremendously, so has the growth of signature fraud.
According to recent studies, only check fraud costs banks about $900M per year with 22% of all fraudulent checks attributed to signature fraud. Clearly, with more than 27.5 billion(according to The 2010 Federal Reserve Payments Study) checks written each year in the United States, visually comparing signatures with manual effort on the hundreds of millions of checks processed daily proves impractical.


Dataset
Contains Genuine and Forged signatures of 30 people. Each person has 5 Genuine signatures which they made themselves and 5 Forged signatures someone else made.
Methodology (Solution Architecture)
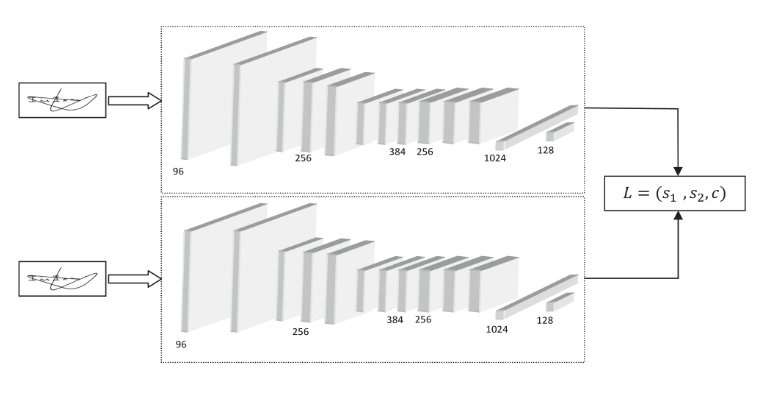
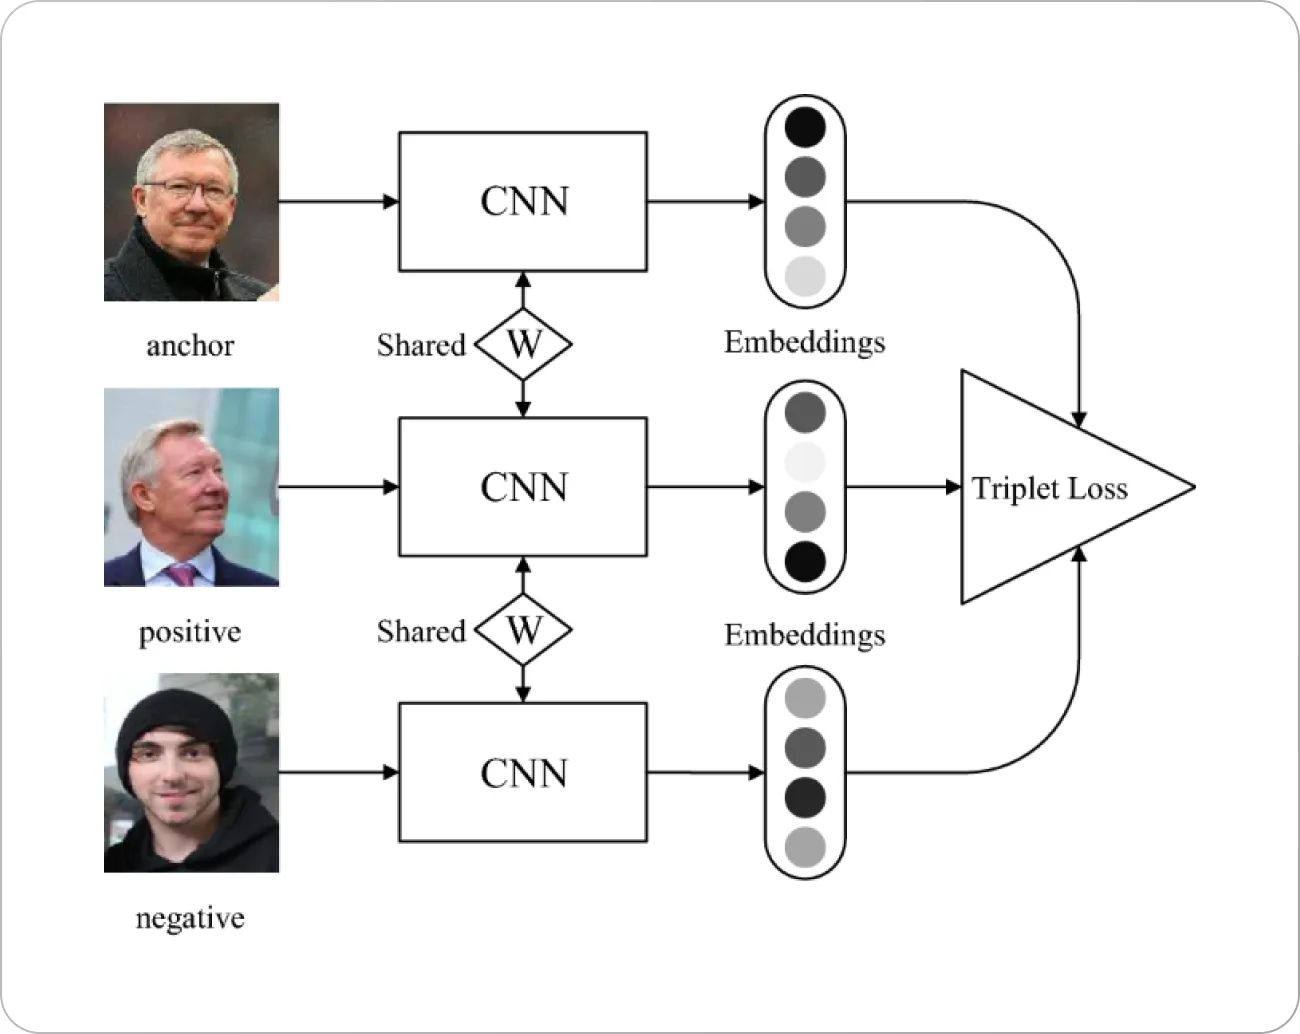
We use a deep convolutional Siamese network. Siamese convolution networks are twin networks with shared weights, which can be trained to learn the feature embeddings, where similar observations are placed in proximity and dissimilar, are placed apart.

Triplet Loss function is used, wherein we contrive the data set in a triplet formation. This is done by taking an anchor image (genuine signature of a person) and placing it in conjunction with both a positive sample (another genuine signature of the same person) and a negative sample (a forged signature by someone else of the same person).

This kind of framework ensures that the squared distance between two genuine signatures of the same individual is small, whereas the squared distance between a genuine and forged signature of an individual is large.
Triplet Loss function is defined as:
\[L(A, P, N) = max(0, D(A, P) - D(A, N) + margin)\]Where:
- ( A ) is the anchor image
- ( P ) is the positive image
- ( N ) is the negative image
- ( D(A, P) ) is the Euclidean distance between the anchor image and the positive image
- ( D(A, N) ) is the Euclidean distance between the anchor image and the negative image
- ( margin ) is a hyperparameter that is used to ensure that the network does not learn to minimize the distance between the anchor and negative images by making it zero.
Evaluation and Metrics
In a traditional classifier, our performance would be based on the best prediction score of all the classes, leading to a confusion matrix with Precision, recall or F1 metrics. In our situation, our model produces embeddings that we can use to compute distances, so we cannot apply the same system to evaluate our model performance.
If the two pictures are from the same class, the distance should be “low”, if the pictures are from different classes, the distance should be “high”. So we need a threshold: if the found distance is under the threshold then it’s a “same” decision, if the distance is above the threshold then it’s a “different” decision.
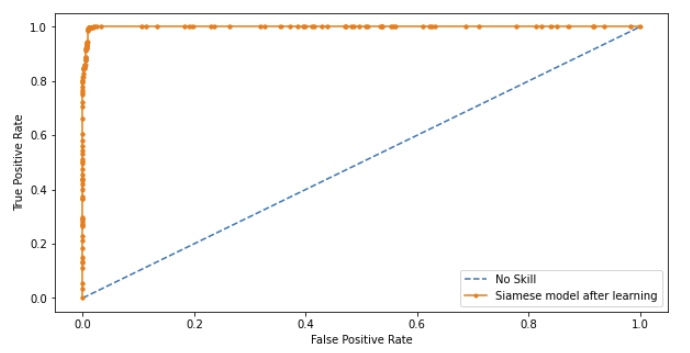
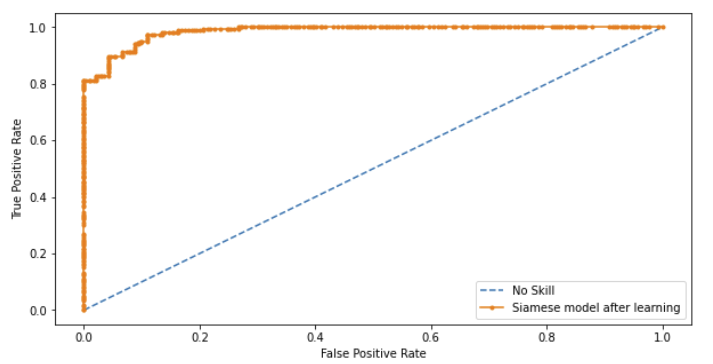
We have to choose this threshold carefully. Too low means we will have high precision but also too many false negatives. Too high and we will have too many false positives. This is a ROC curve problem. So, one metric for evaluation could be Area Under the Curve (AUC).
Thresholding and Prediction
As mentioned previously, evaluation and prediction are not as straightforward as other simpler CNN classification models. The procedure to predict whether a signature is real or forged is as follows:
- Ensure that for the test image you want to classify, you have an anchor image(Ref. methodology).
- Use dist=siamese_model.predict(anchor_image,test_image) , to get the embeddings of the anchor image and test image and find the euclidean distance between the embeddings.
- Check whether the Euclidean distance obtained is greater or less than the optimal threshold:
if dist < threshold:
    print("The signature is Genuine")
else:
    print("The signature is Forged")
To find the optimal threshold i.e the optimal distance value to classify as “Real” or “Forged” we plotted a ROC graph. But before plotting the graph we needed to obtain distance measures between (Anchor images, Real Images) and (Anchor Images, Forged Images) and obtain two arrays called pos and neg. These 2 arrays were concatenated. This concatenated array was nothing but our y_pred. This was then used in conjunction with y_true in order to evaluate the model and also to find the optimal threshold.
Using the ROC graph plotted, we used a simple formula to find the most “optimal” cut off point on the ROC graph, this optimal point, if used as a threshold for classification, must yield Low False Positive Rate(FPR) and High True Positive Rate(TPR).
The formula used to find the optimal threshold is:
optimal_idx = np.argmax(tpr - fpr)
optimal_threshold = thresholds[optimal_idx]
Where:
- tpr is True Positive Rate
- fpr is False Positive Rate
- thresholds are the thresholds obtained from the model.
Results
Training Data:
AUC Score: 0.999 (3650 samples)
Optimal Threshold Found From ROC AUC Curve:  0.002733261790126562
Accuracy:  0.9919836956521739
F1 Score:  0.9920281043102284
Confusion Matrix:
| Predicted Genuine | Predicted Forged | |
|---|---|---|
| Actual Genuine | 3630 | 50 |
| Actual Forged | 9 | 3671 |

Test Data:
AUC Score: 0.985 (920 samples)
Optimal Threshold Found From ROC AUC Curve:  0.0013851551339030266
Accuracy:  0.9315217391304348
F1 Score:  0.9341692789968652
Confusion Matrix:
| Predicted Genuine | Predicted Forged | |
|---|---|---|
| Actual Genuine | 410 | 50 |
| Actual Forged | 13 | 447 |
